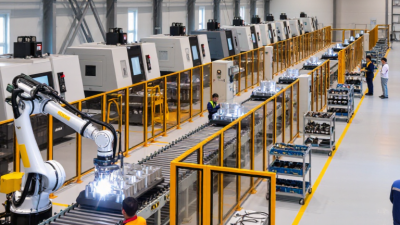
Choosing manufacturing automation solutions is rarely a simple equipment purchase. It is an operational decision that affects people, quality, maintenance, data, and future growth. A robotic arm may look impressive on a factory floor, yet still create delays if operators cannot adjust it quickly. The best choice begins with the actual process, not a supplier’s brochure.
Walk through the production line and record the details that numbers often hide. Note changeover time, rejected parts, repeated lifting, machine stoppages, and manual inspection points. A practical manufacturing automation assessment should connect these observations with measurable goals. These may include shorter cycle times, safer material handling, stable product quality, or lower maintenance costs. Do not trust optimistic payback claims without checking assumptions. Ask how the figures treat training, integration, spare parts, software updates, and downtime.
Start small.
A controlled pilot can reveal problems before a major investment. Test the solution with real materials, real operators, and representative production volumes. Check whether it communicates reliably with existing equipment. Confirm that employees can understand alarms and complete routine recovery tasks. Vendor experience matters, but documented results matter more. Request references from facilities with similar products, shift patterns, and environmental conditions.
There is no perfect automation system. Even a well-designed installation may require further tuning after launch. That is not failure; it is useful evidence. Review performance data regularly, listen to operators, and adjust the plan when reality differs from the original model. A reliable decision balances technical capability, human experience, supplier accountability, and long-term business value.
How to Choose Manufacturing Automation Solutions?
Defining Manufacturing Goals and Automation Requirements
Automation decisions should begin with a measurable production problem. A busy line is not always an automation opportunity. Track cycle time, changeover minutes, defect rates, labor movements, and unplanned stops for several weeks. Speak with operators during different shifts. They often notice jams that dashboards miss. A clear baseline prevents attractive technology from solving the wrong issue.
Define the target before reviewing equipment. For example, you may need 240 units per hour, consistent torque, or fewer manual lifts above shoulder height. Specify product variations, material tolerances, floor space, utility access, and cleaning procedures. Safety requirements must include guarding, emergency stops, ergonomic risks, and operator training. Quality controls should identify where measurements occur and what happens when results fail.
Pilot the proposed process with realistic parts, packaging, and staffing. Test normal production and difficult changeovers. Our first automation estimate ignored ten-minute tool changes, so its projected payback was too optimistic. That mistake changed the evaluation method. Require evidence for uptime, maintenance time, integration effort, and spare-part availability. Ask who will troubleshoot the system at 2 a.m. Document assumptions, even uncomfortable ones. A slower pilot may reveal a better requirement.
| Manufacturing Area | Primary Business Goal | Current Baseline | Target Outcome | Recommended Automation Requirement | Key KPI | Priority | Validation Method |
|---|---|---|---|---|---|---|---|
| Material Handling | Reduce manual transport and improve material flow between workstations. | Operators spend approximately 60–90 minutes per shift moving components. | Reduce non-value-added transport time by 30–50%. | Automated guided transport with defined routes, safety scanners, load detection, and integration with production scheduling. | Material movement time | High | Compare operator travel time, delivery accuracy, and line stoppages before and after implementation. |
| Assembly Operations | Increase throughput while maintaining consistent assembly quality. | Output varies by operator experience and manual cycle-time differences. | Improve cycle-time consistency and increase throughput by 15–25%. | Automated assembly equipment with programmable motion, error-proofing, torque monitoring, and recipe management. | Cycle time and first-pass yield | High | Measure average cycle time, variation between cycles, rework rate, and first-pass yield. |
| Quality Inspection | Detect defects earlier and reduce the cost of poor quality. | Inspection is performed manually at selected process stages, with limited traceability. | Achieve inspection coverage above 95% for defined critical characteristics. | Automated inspection using calibrated sensors or vision systems, defect classification, data storage, and reject handling. | Defect escape rate | High | Verify detection capability using known-good and known-defective samples, then track customer and downstream escapes. |
| Packaging and Palletizing | Improve packaging consistency and reduce ergonomic risks. | Repetitive lifting and manual stacking create variable pack quality and operator fatigue. | Reduce manual lifting by at least 70% and maintain consistent pallet patterns. | Robotic or automated packaging with product detection, adjustable formats, pallet pattern control, and guarded access. | Units packed per hour | Medium | Track throughput, damaged packaging, pallet stability, and manual handling hours. |
| Production Scheduling | Improve schedule adherence and respond faster to demand changes. | Scheduling relies on spreadsheets or disconnected systems, causing frequent manual updates. | Reach schedule adherence of 90% or higher for stable product families. | Production planning software with real-time work-center status, order prioritization, capacity constraints, and digital dispatch lists. | Schedule adherence | High | Compare planned versus actual start and finish times across multiple production cycles. |
| Equipment Monitoring | Reduce unplanned downtime and improve maintenance decisions. | Machine conditions are checked periodically, and failure data is often recorded after an event. | Reduce unplanned downtime by 15–20% within the first improvement cycle. | Connected sensors for vibration, temperature, current, pressure, and runtime, supported by alert rules and maintenance workflows. | Unplanned downtime | High | Establish a downtime baseline, monitor alarm accuracy, and compare mean time between failures. |
| Energy Management | Lower energy consumption without reducing production capacity. | Energy use is commonly available at facility level rather than by machine or process. | Reduce energy use per finished unit by 8–15% in selected processes. | Sub-metering, machine-level energy monitoring, idle-state controls, and dashboards linked to production output. | Energy per finished unit | Medium | Normalize energy data against production volume, operating hours, product mix, and seasonal conditions. |
| Workforce Support | Improve operator effectiveness and reduce training time. | Work instructions may be paper-based or inconsistent across shifts. | Reduce training time for selected operations by 20–30% and improve procedure compliance. | Digital work instructions with visual guidance, revision control, barcode or part verification, and multilingual support where needed. | Training time and error rate | Medium | Measure time to proficiency, procedural deviations, operator feedback, and quality results by shift. |
| Data Integration | Create reliable production data for performance analysis and continuous improvement. | Machine, quality, maintenance, and inventory data are stored in separate systems or entered manually. | Capture accurate, time-stamped data for at least 90% of critical production events. | Standardized data interfaces, equipment connectivity, role-based access, audit trails, and compatibility with existing enterprise systems. | Data completeness and accuracy | High | Audit data availability, timestamp accuracy, system uptime, and reconciliation with production records. |
| Safety and Compliance | Improve workplace safety while meeting applicable operational requirements. | Risk controls depend on manual procedures, physical barriers, and periodic inspections. | Eliminate or reduce identified high-risk manual tasks and maintain documented safety verification. | Risk assessment, safeguarding, emergency stops, access control, safety-rated controls, and documented validation before operation. | Recordable incidents and safety findings | High | Complete formal risk assessment, safety-function testing, operator training, and periodic compliance audits. |
| Investment Planning | Select solutions that provide measurable value and remain adaptable as demand changes. | Projects are often evaluated primarily on equipment price rather than total lifecycle cost. | Approve projects with defined payback, scalability, maintainability, and measurable operating benefits. | Business case covering capital cost, integration, training, maintenance, downtime during installation, expected savings, and future expansion. | Total cost of ownership and payback period | High | Review a pilot or simulation, calculate lifecycle cost, and compare actual performance with approved financial assumptions. |